
Challenge: Accurate Dynamic Reservoir Modelling
A PLT is a common logging tool which provides flow profile inside the wellbore only. This type of tool cannot provide the formation flow profiles as well as crossflow above-between-below perforated intervals. If only PLT log data is used for 3D dynamic modeling this could lead to discrepancies in the dynamic reservoir model which could affect further field development. The log data from the SNL acoustic tool can identify which intervals are accepting water in water injection wells and which intervals are producing in production wells. With the log data from the combination tool this will improve the accuracy of the dynamic reservoir model and ultimately improve recovery such as identifying un-swept oil saturated areas which could be targets for future infill drilling.
RFA Logging Result
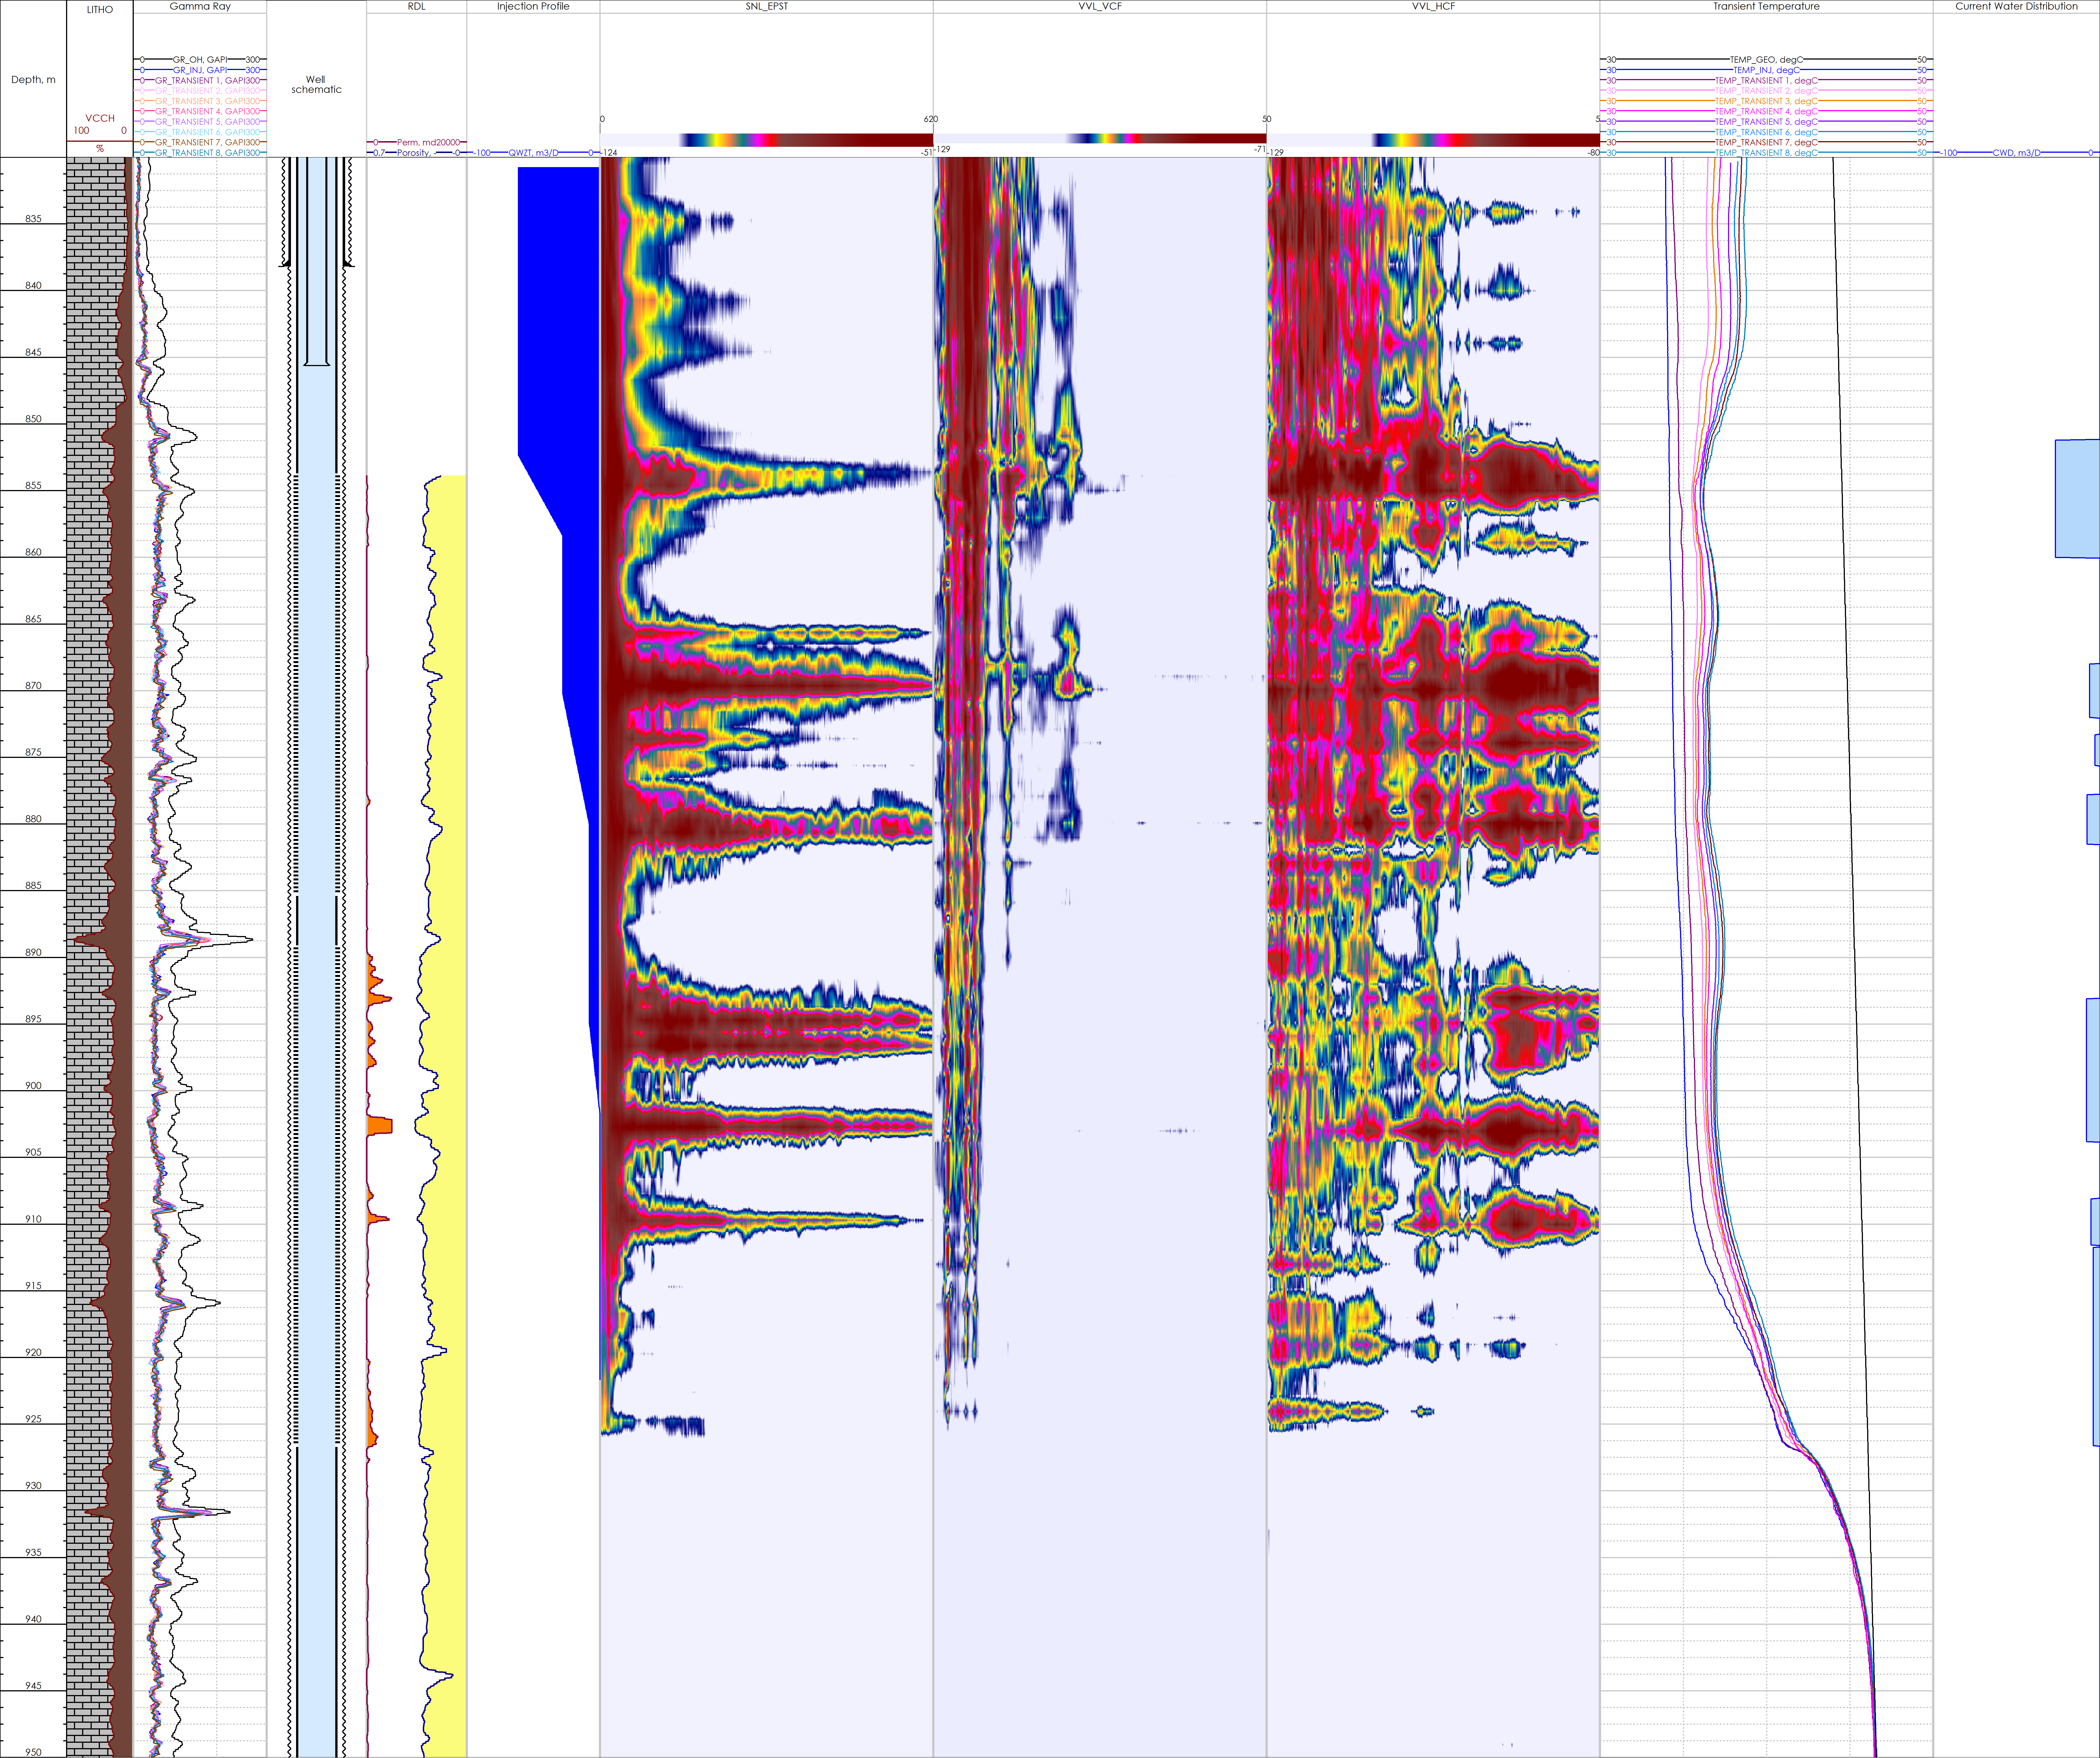
One example when a PLT survey was done in combination with acoustic logging and relaxation temperature is shown below:
The well is a vertical water injector drilled in 2022. The well was completed with a 13 3/8” surface casing, 9 5/8” intermediate casing and a 7” liner. The well has 2 sets of perforations.
A reservoir flow analysis survey was conducted in 2023. The main objective was to understand the formation intake zones and sweep efficiency. The well was under stable injection conditions prior to logging. A PLT was conducted across the perforated intervals followed by acoustic logging. The well then shut-in and a shut-in PLT survey was conducted, followed by a number of relaxation temperature passes across the same intervals.
Interpretation Summary
- The injection rate, calculated from spinner data during injection survey was 61.4 m3/d. Three main intake zones were identified from the spinner: 852.4-858.4 m, 870.2-880.1 m and 894.9-901.7 m.
- The shut-in PLT indicated stable wellbore conditions with no crossflow between, above or below the perforated intervals.
- SNL-VVL data, injection and relaxation temperature curves show that there is no injection below depth 927 m.
- Both SNL and VVL identified the following intake zones: 850.0-860.0 m, 864.7-885.5 m, 892.6-895.7 m, 895.8-898.2 m, 901.1-904.1 m, 908.7-921.2 m and 924.3-926.5 m. Note, most of the intake zones are very narrow and corresponded to high permeable layers.
- SNL and VVL along with the relaxation temperature detects intake zones below depth 902 m which was not captured by the spinner due to flow rate limitations (below 7 m3/d).
- Relaxation temperature curves recorded after 2 hours, 3 hours, 4 hours, 6 hours, 8 hours, 10 hours, 12 hours of shut-in were used for current rate distribution. Seven main intakes zones were detected. The maximum volume of injected water (43%) is accepted by the top section of the upper perforated interval 851.2-860 m.
- The static temperature curve recorded after 20 days of shut in, was used for cumulative water profile distribution. Six main intake zones were identified with maximum injection of 38.7% across 893.2-909.1 m (middle part of lower perforated interval).
Conclusion
It is recommended to run the PLT and acoustic logging tools in combination. The PLT cannot provide an accurate picture of all the intake zones due to the threshold limit below which it cannot detect flow. The PLT will show the wellbore profile only, whereas the acoustic tool will identify the exact intake zones. It can also identify possible crossflow above or below perforated intervals which can be considered as inefficient injection into the desired target zones.
All case studies


Looking for more information?
Get in touch with us and our representative will get back to you
Contact Us