
PLT and Temperature Logging
The well is a vertical barefoot steam injector which was drilled in 2009. After drilling the well was completed with a 13 3/8” conductor, 9 5/8” surface casing and 7” intermediate casing. A 4.5” pre-drilled liner (PDL) was installed across the barefoot section. The steam was injected through vacuum insulated tubing (VIT).
A PLT was conducted in 2022 with the main objective to obtain the injected steam profile and distribution across the barefoot section. In addition, several relaxation temperature passes were recorded to understand the formation intake zones. The relaxation passes were recorded as follows: after 72 hours, 80 hours, 96 hours, 104 hours, 120 hours, 128 hours, 134 hours, and 144 hours of shut-in.
Interpretation Summary
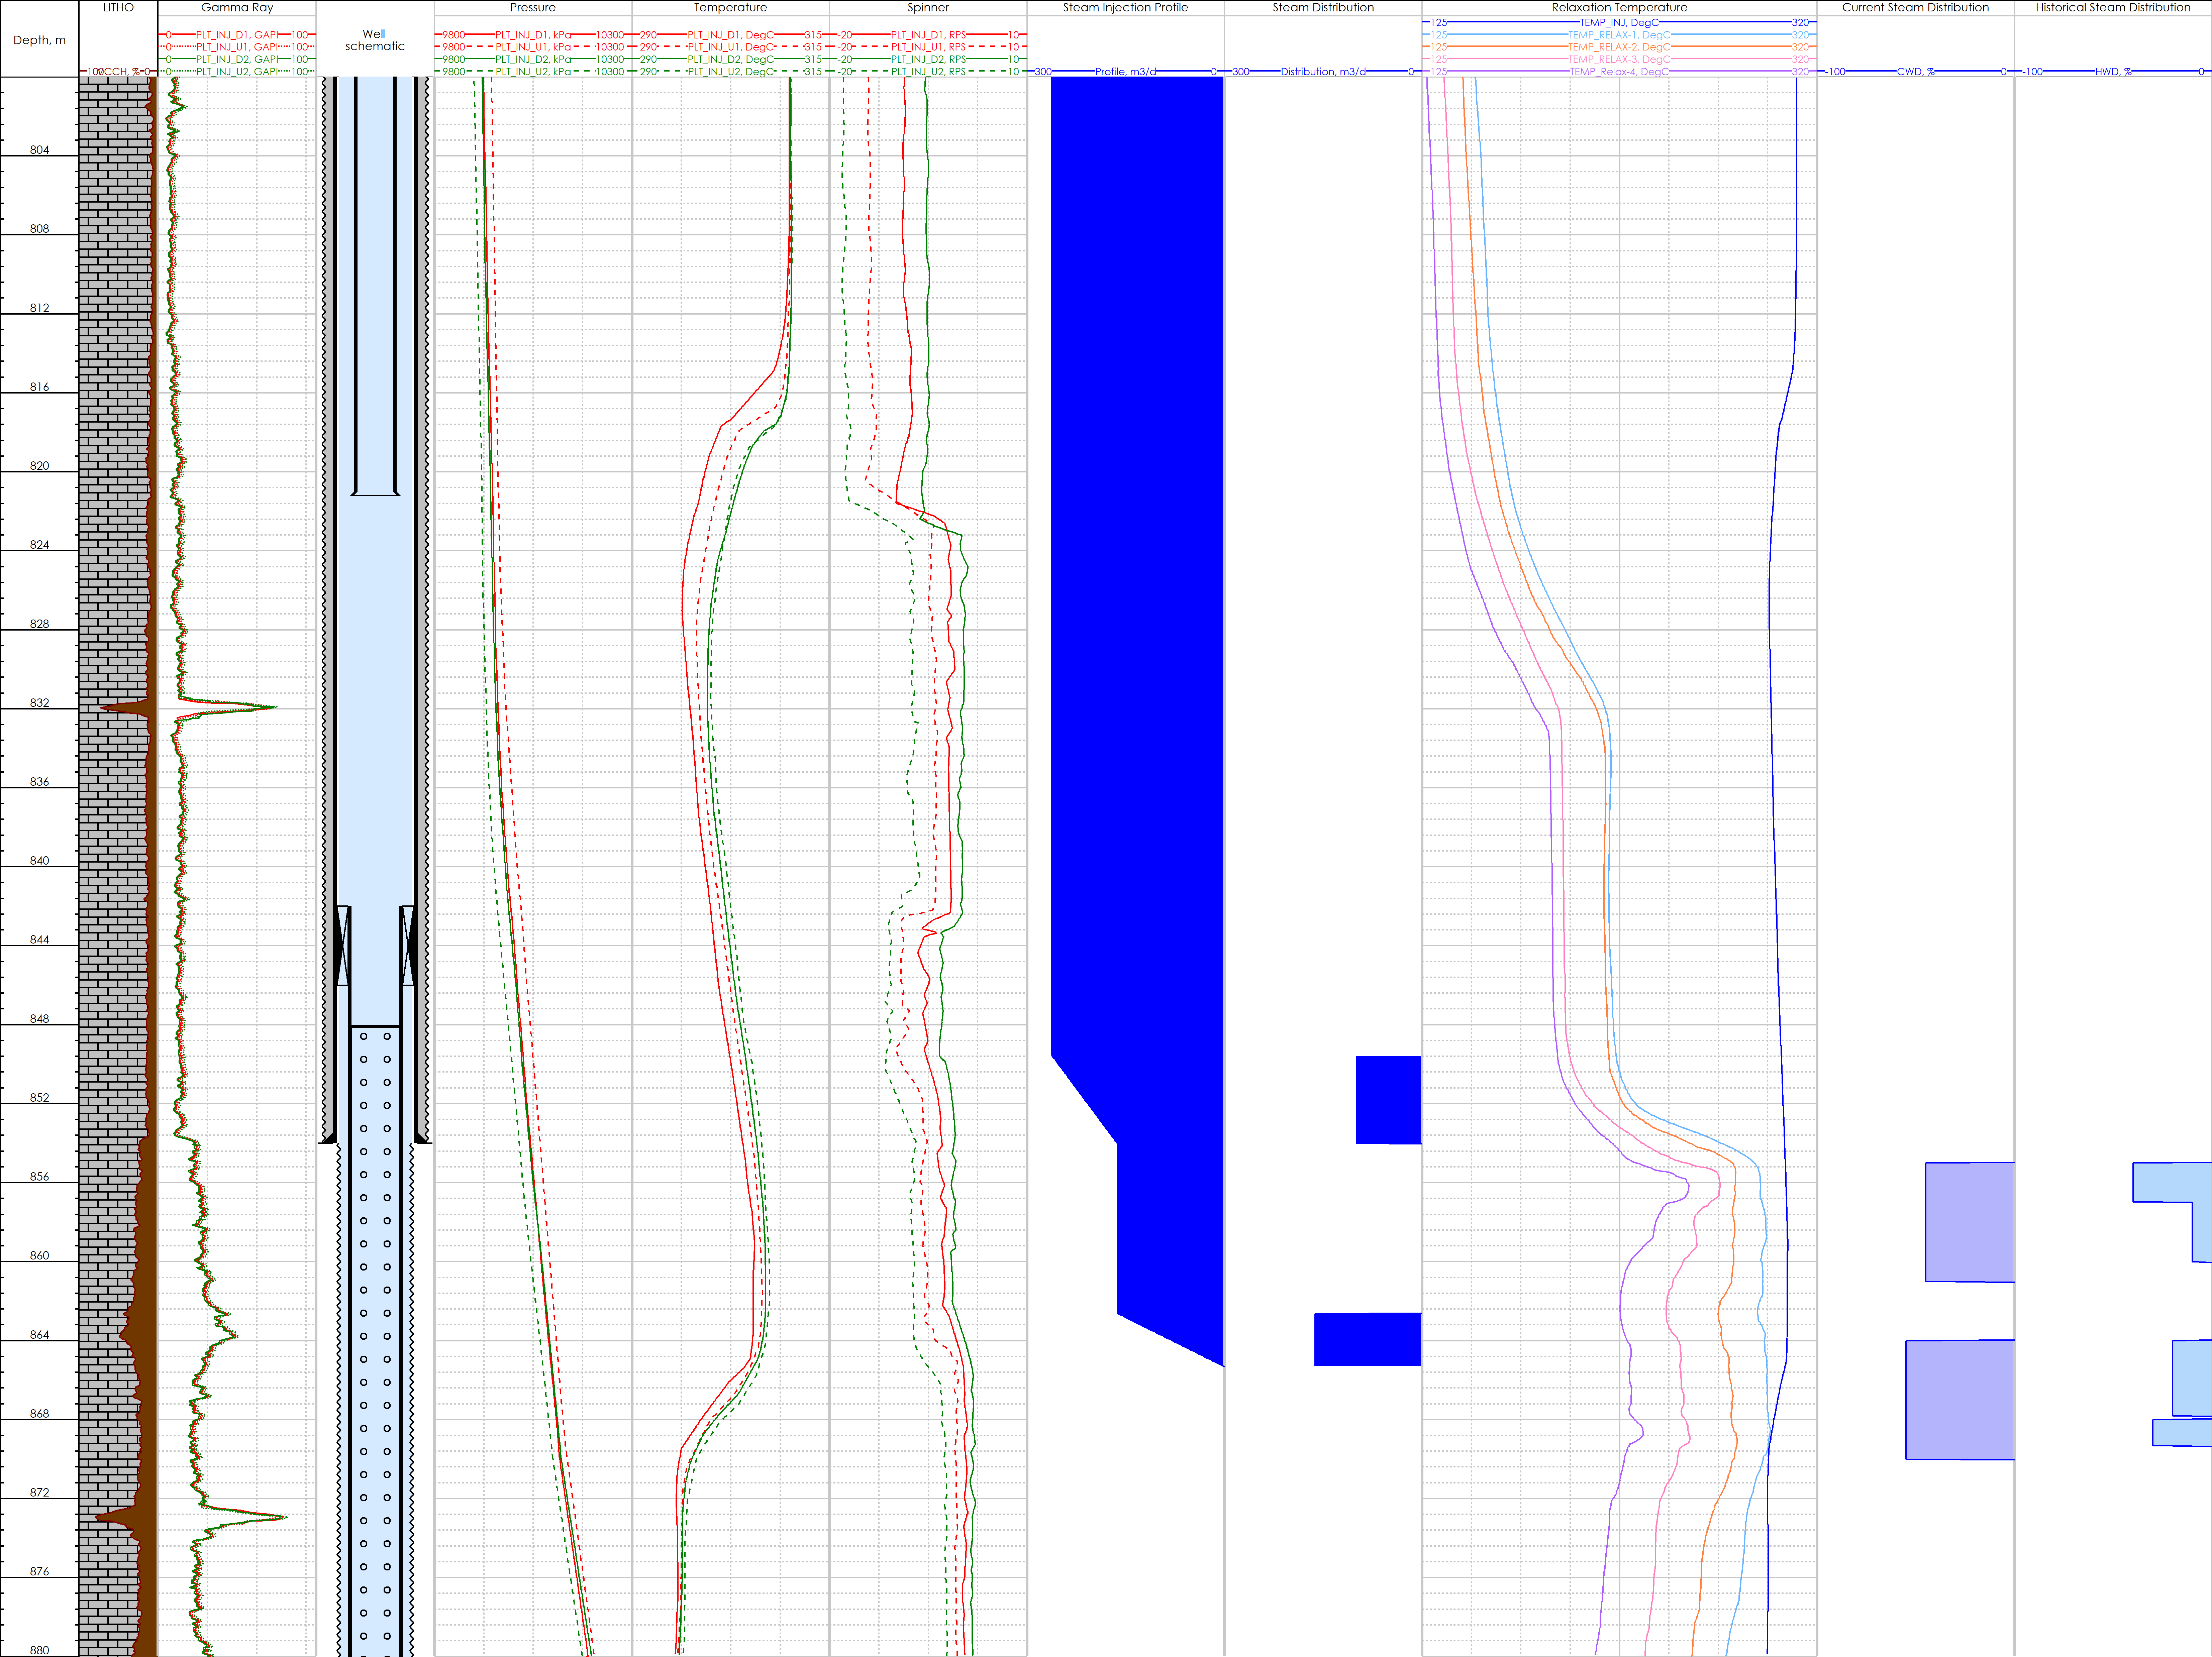
- The steam injection rate was calculated from the spinner data during the injection survey equaling 280 m3/d. The calculated injection steam rate is almost an exact match with the surface rate supplied from the steam generator at 300 m3/d.
- The two main intake zones in the PDL are 849-854 m and 862-865 m with an almost equal distribution between zones.
- The shape of the injection temperature curves indicated that the steam injection stops at 870 m.
- The relaxation temperature curves, recorded after 72-104 hours of shut-in were used for current formation steam distribution. These curves indicated the presence of two main intake formations at 855-861 m and 864-870 m where the upper zone is taking 45% of the total injected steam and the lower zone takes 55% of the injected steam.
- The relaxation temperature curves, recorded after 120-144 hours of shut-in, were used for historical steam distribution into the formation. The steam was accepted approximately within the same two intervals. However, the steam distribution is non-uniform: the majority of the steam goes into the upper part of the first interval and the lower part of the second interval.
- The relaxation temperature curves indicated that the steam heated the formation to 833 m. Above this depth the temperature curves showed a standard relaxation trend. It appeared that the shale layer at 831-833 m prevents the overlying formation from heating.
All case studies


Looking for more information?
Get in touch with us and our representative will get back to you
Contact Us