
Integrity Challenge
From previous case studies it is evident that in artificially lifted wells with either a bean pump (BP) or a progressive cavity pump (PCP) wear areas and associated corrosion are visible. This is caused by the sucker rod (SR) couplings as they are reciprocating or rotating over the same intervals against the wall of the tubing, the additional friction of the coupling on the tubing can cause wear and ultimately compromise the tubing integrity. The additional friction i.e., drag can also result in an impairment to the pump performance and a reduction in production.
For an effective well integrity monitoring program it is important to monitor wells on a regular basis to determine in a timely manner when to plan and execute a workover. Therefore, preventing a potential loss of integrity and well failure thus minimizing deferment and associated costs.
Corrosion Logging Result
One example when the EMDs corrosion logging tool was combined with the Multi Finger Caliper logging tool (MFC) is shown below:
The well is an S-Shape PCP oil producer drilled in 2011. The well was completed with a 9 5/8” surface casing and a 7” production liner. In 2019, during a Hoist intervention a 7” scab liner was run to the top of the 7” production liner.
In 2022 the existing tubing was replaced with a 3.5” completion string, the PCP stator was set below the S-shape interval at 805.82 m. The SR assembly consisted of rods with no centralizers in the vertical sections and rods with centralizers across the deviated interval from 360-700 m.
The EMDs log data revealed the presence of numerous wear areas on the tubing caused by buckling of the SR assembly against the internal tubing wall during the SR rotation. Defects were caused by the SR couplings and centralizers. The circumferential calculated metal loss ranged from 5.0-13.4%. Minor corrosion was also identified in the areas of wear.
The MFC log data confirmed the EMDs log findings. In addition, the MFC provided very detailed information about the defect locations, size and remaining wall thickness.
- The tubing from surface-208 m (vertical section) had light general corrosion with maximum metal loss from 5-9%.
- Erosion caused by the SR coupling. The tubing from 208-344 m (vertical section) had areas of wear caused by the contact of the SR coupling against the tubing internal wall due to additional side forces. The areas of wear were detected every 9 m which is the length of the SR joint. The wear areas matched the coupling size, width 7cm and height 2 cm. Maximum metal loss from 17-20%.
- Erosion caused by the SR centralizers. The tubing across the S-shape section of the well (345-700 m) had numerous wear areas caused by the SR centralizers contacting the internal tubing wall during SR rotation. The size of the wear areas corresponded to the centralizer dimensions, width 7 cm and height 3 cm. It was possible to verify the actual dimensions of the centralizers as there were SR assemblies available on location. Maximum metal loss was from 40-43% identified at 377.4 m, 379.1 m and 623 m.
- Combination of SR body and centralizers erosion. From 582-700 m in addition to erosion caused by the centralizers, the additional forces due to the deviation in the lower part of the well bows the sucker rod to an extent that the sucker rod body contacts the internal tubing. This causes additional friction and metal wear.
Conclusion
Logging was conducted a few months later after the new completion with SR assembly was installed. However, the tubing condition could not be considered as optimal. Almost all of the interval that was logged had wear areas, especially from 300 m where the deviated S-shape interval started. There was a very good correlation between the SR tally and the metal loss curves from both the EMDs and the MFC logs. At intervals where the SR’s were run without centralizers, only wear from the SR couplings was observed. From 321-705 m areas of wear were induced by the centralizers and the SR coupling friction.
The EMDs data showed an average circumferential metal loss whereas the MFC showed the exact metal loss. The difference observed between the logging tools reached up to 30% across some areas.
Further logging data and analysis can assist in determining an optimized centralization program.
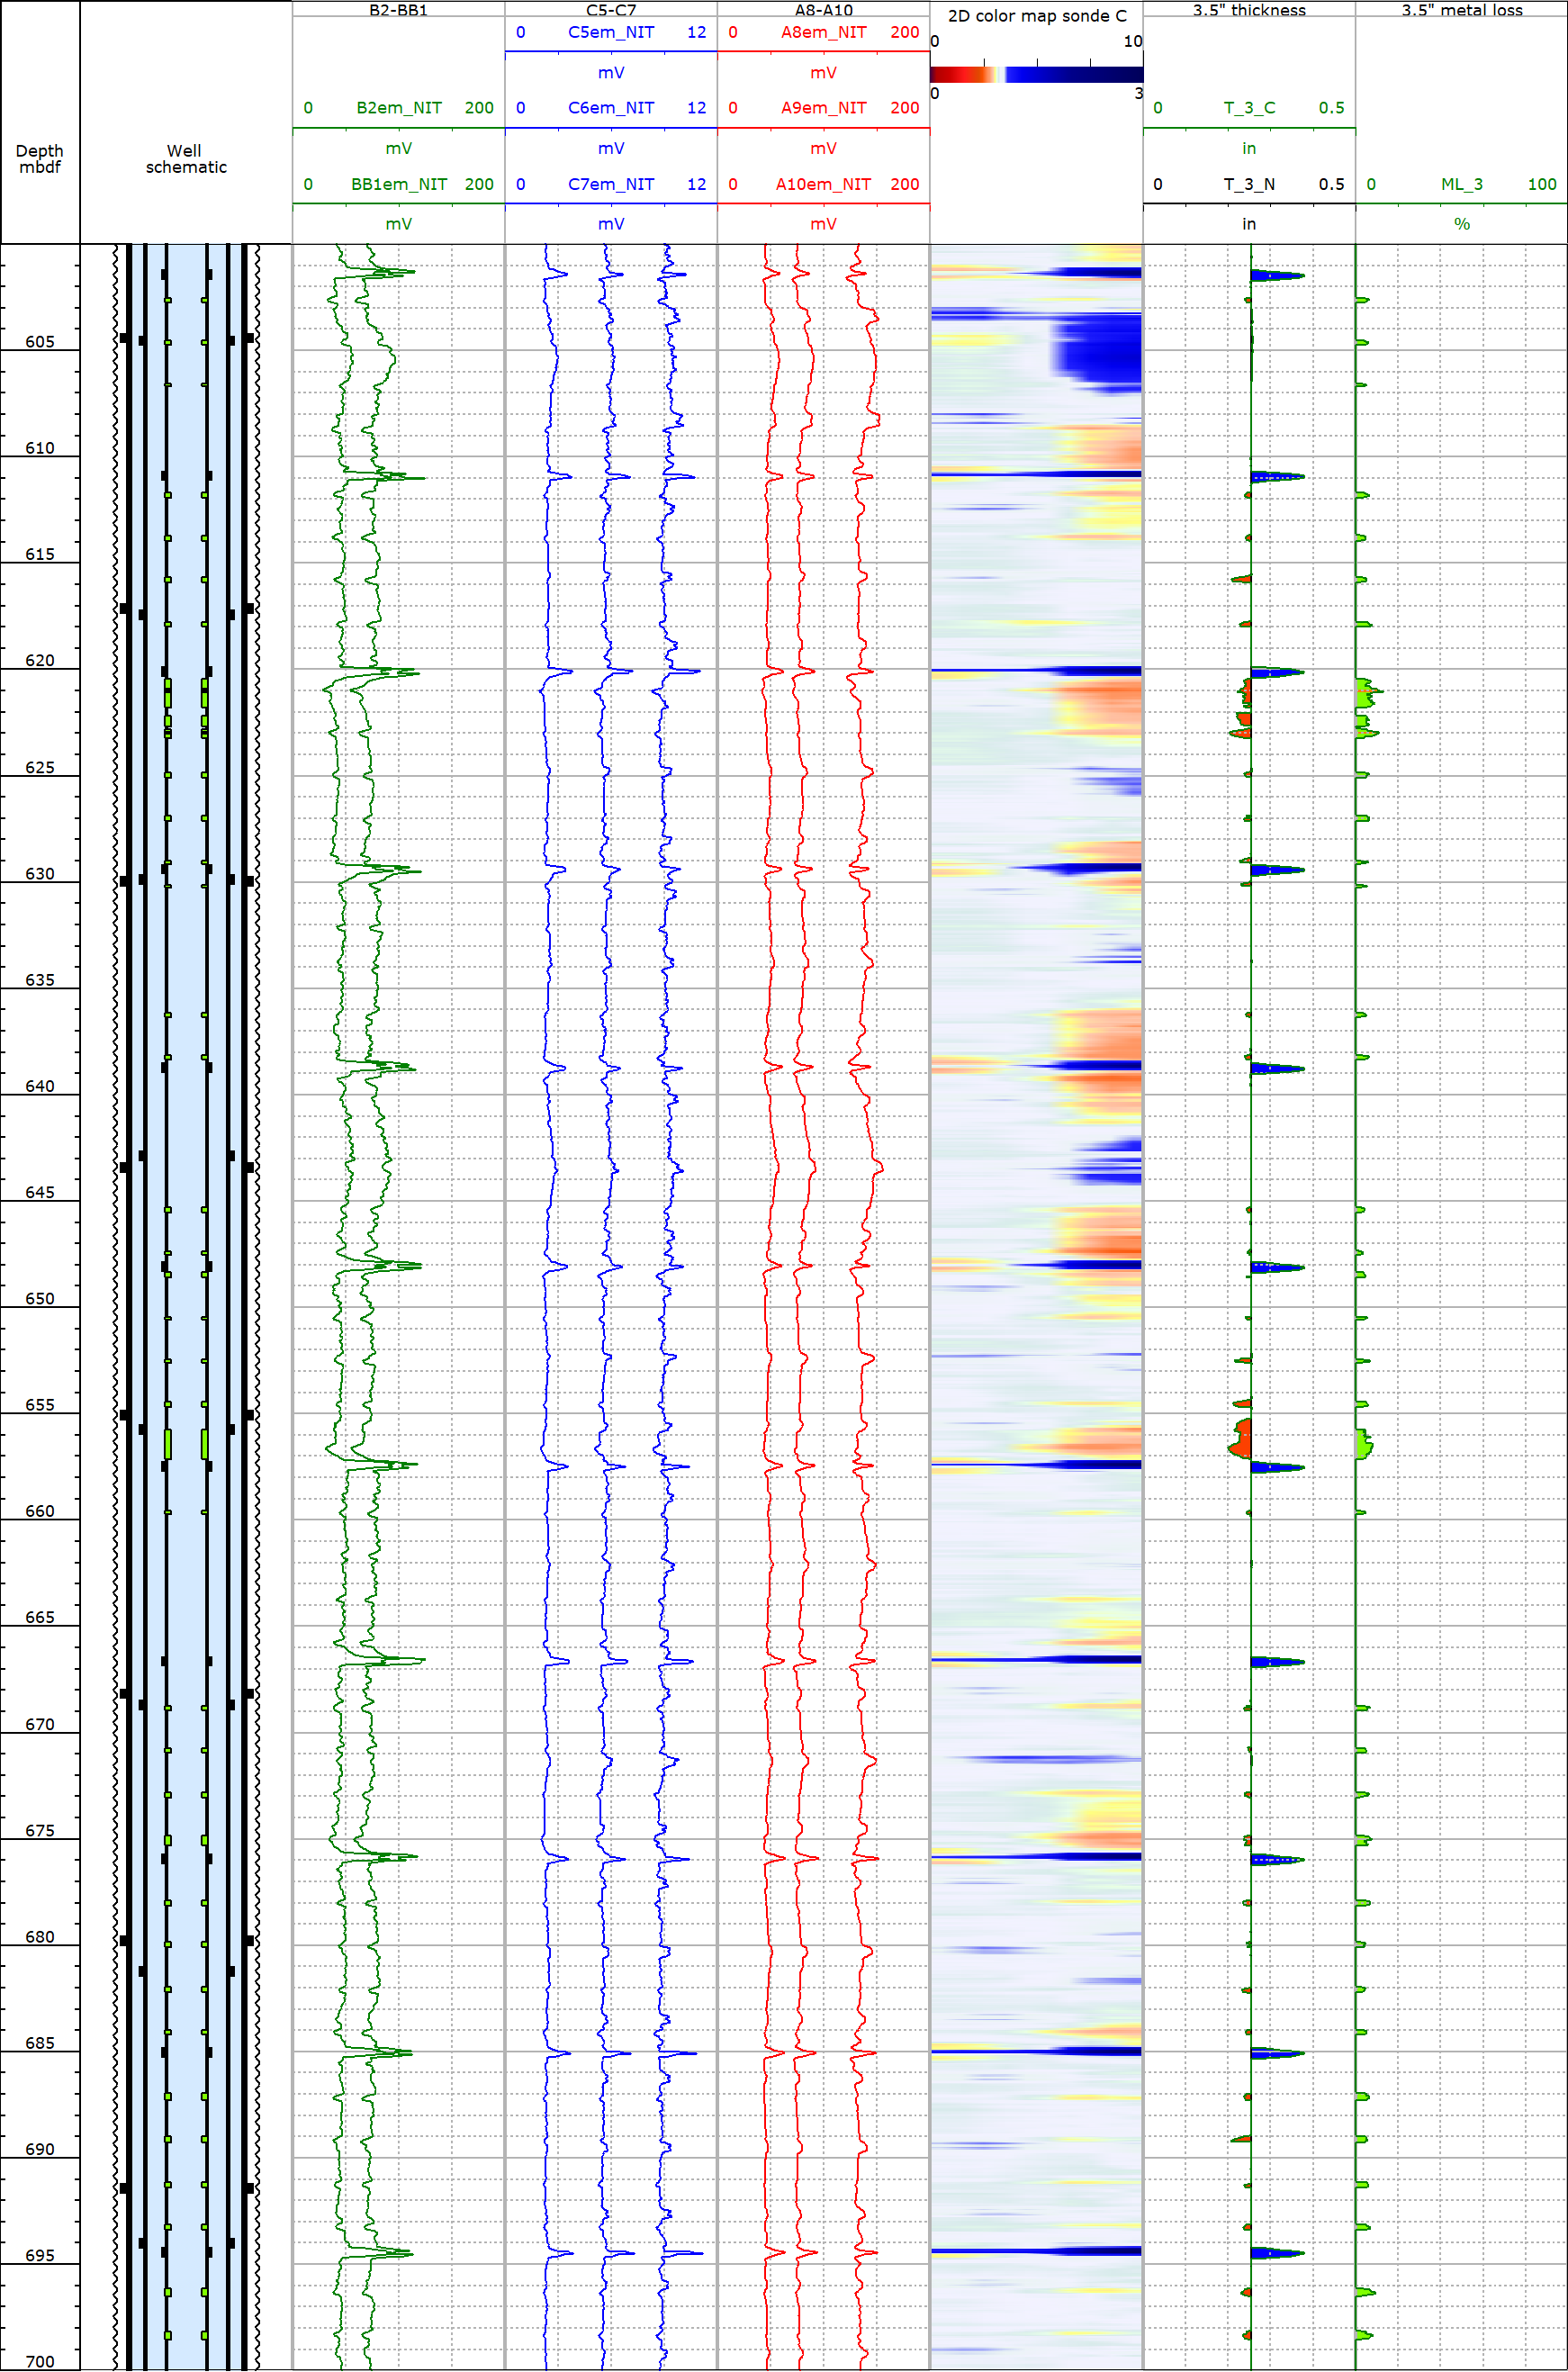
EMDs Data with Calculated Thickness and Metal Loss.
Scenarios of wear areas and metal loss across logged interval in PCP well


All case studies


Looking for more information?
Get in touch with us and our representative will get back to you
Contact Us