
Field Overview
The field is located in the south of the Sultanate of Oman.
The first well was drilled & completed in 1987 followed by a total of 45 wells in 28 years
Until 2010 all the wells were drilled vertically and had a similar completion design i.e., dual barriers across the upper section of the well with surface and production casing. The shoe of the 13-3/8” surface casing was placed across the Shammar formation and the 9-5/8” production casing covered the zone of interest. The exception was in years 2004 and 2011 where the 13-3/8” surface casing was replaced by a 9-5/8” casing coupled with a 7” production casing. From 2011 the well design changed to drilling horizontal reservoir sections. The average kick-off depth was 500 m with a horizontal section of 500-600 m across the zone of interest. The openhole horizontal sections were completed with 7” wire wrapped screens (WWS).
Drilling activities increased from 2015 with an average of between 13 to 20 wells drilled every year. At the end of 2021 the total number of existing wells was 163. This group of wells all have a similar completion design when compared to the previous horizontal wells. All wells have dual barriers across the upper section i.e., surface casing and a production casing.
In 2015 and from 2018-2021 the well design was changed to a 9-5/8” surface casing and a 7” intermediate casing. The reservoir section was completed with 4.5” wire wrapped screens.
EMDs Overview
A corrosion monitoring campaign started in this field from 2013 as part of a well integrity strategy program. By the end of 2021 42 wells had been logged with the EMDS logging tool. 16 of the wells had repeat logs run after 6-7 years.
Temperature and Gamma Ray Analysis
The first observation from the log data was related to the gamma ray and temperature logs. The logged wells can be divided into two groups based on temperature and gamma ray behavior.
Group A The temperature curve had a clear indication of pronounced crossflow at an interval 540-190 m. The gamma ray has an abnormally high value at approximately 250-340 m.
Group B The temperature curve had no indication of crossflow and showed a standard temperature gradient across the upper section of the well. The gamma ray also had no abnormal values.
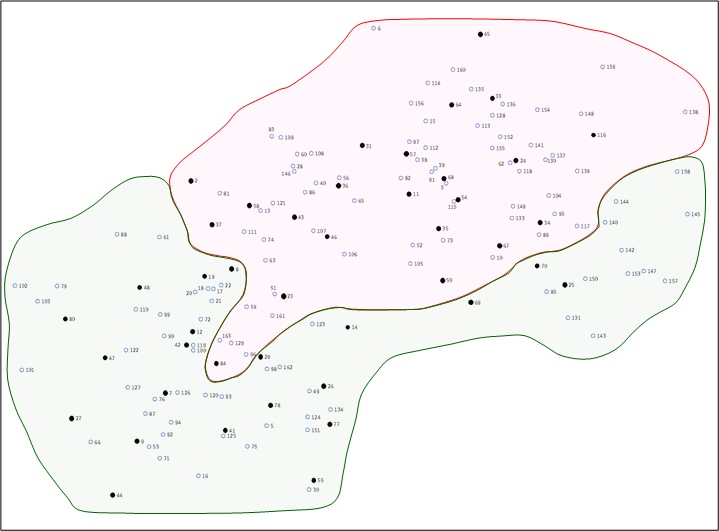
The map below shows all the wells drilled and the two groups of wells:
Metal Loss Analysis
A detailed analysis of metal loss was completed.
Step 1
EMDS logging was conducted in most of the wells 5 years from the initial well completion date. Based on the log data a direct comparison of metal loss across the field was conducted.
The finding was that 30% of the wells logged had moderate to severe metal loss in the 13-3/8” surface casing, indicating a very aggressive corrosion rate. However, it should be noted that 55% of the wells logged showed no indication of metal loss.
Step 2
To allow the metal loss trend to be calculated several wells were re-logged 15-16 years from the original well completion date.
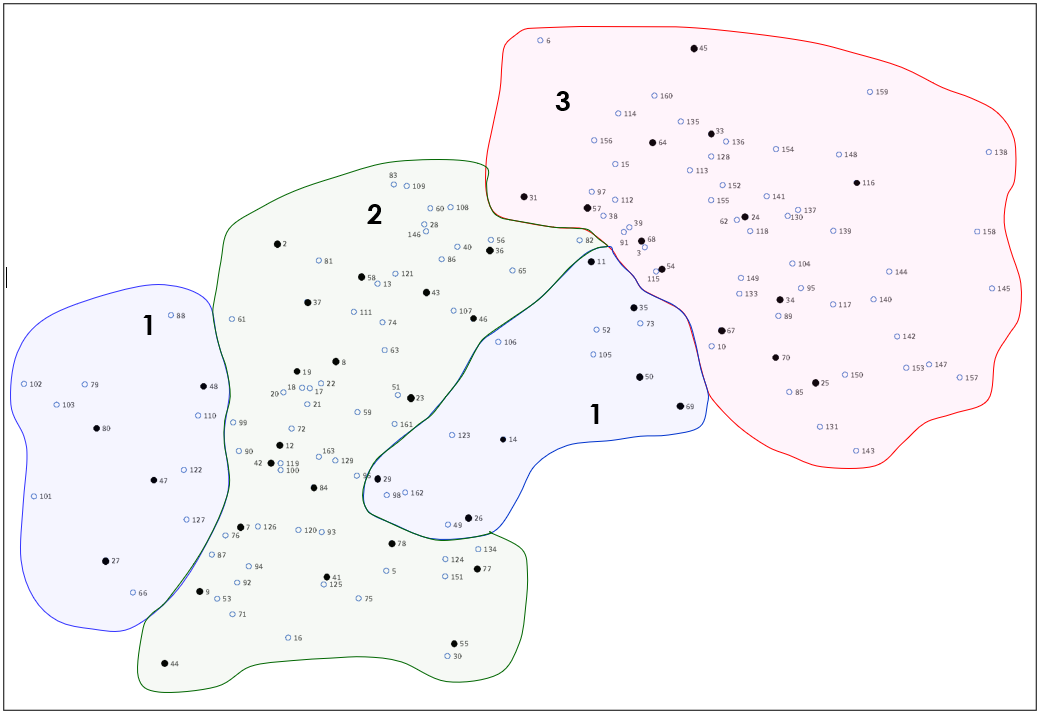
Based on the corrosion trend the wells can be divided into three groups where each group had a similar trend in the rate of corrosion in the 13-3/8” casing.
Metal loss after 15 years from well completion
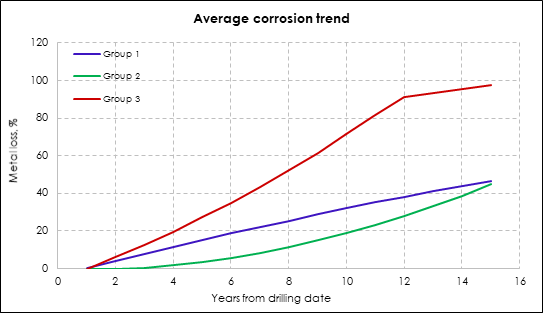
When detailed analysis was completed, the following common patterns were discovered:
- The metal loss trend in Group 1 is linear where corrosion was initiated immediately from the well completion date. The average metal loss per year was 2-3% reaching 40-45% after 15 years.
- The metal loss trend in Group 2 was exponential. Metal loss was initiated 3 years from the completion date on average and reached up to 45% after 15 years.
- The metal loss trend in Group 3 is almost linear where corrosion initiated from the well completion date. Metal loss reached almost 100% after 15 years.
The plot below shows the average corrosion rate of each group.
Based on the analysis above, the following recommendations were provided to the client:
- To clarify the boundaries between Groups 1, 2 and 3, wells which were drilled 7-8 years ago should be scheduled for corrosion logging.
- High priority should be given to all wells in Group 3.
- As a proactive measure, install a 7” scab liner in Well-31 and Well-33.
- Repeat corrosion logging in Well-34 which is included in Group 3. Note EMDS logging was conducted 5 years from the well completion date which was in 2013, the current predicted metal loss in the surface casing is approximately 100%.
- From the EMDS log data the majority of wells have corrosion across an interval of 150-180 m. It is recommended that in future the surface casing should be externally coated from the surface-250 m.
- The current design of the 7” production casing could be changed. This should be run in two stages, the first is as a production liner from 600 m to the desired depth, the second as a tie back liner run from 600 m back to the surface. This will allow the replacement of the upper 7” liner if the B annulus integrity failed. This would remove the requirement to install a 5.5” scab liner with its associated restriction in ID.
Conclusion
The logging tools can identify corrosion through multiple pipes. The field well integrity analysis identified a common pattern of corroded intervals. Based on the results a proactive plan of corrosion monitoring was established. This data also enabled remedial activities to be planned before well integrity was further compromised. The data can also be used to optimize well designs to minimize corrosion in future wells.
All case studies


Looking for more information?
Get in touch with us and our representative will get back to you
Contact Us