
Tool Overview
The new generation of acoustic tool (EPST) was designed to provide reservoir flow analysis (RFA), identify leaks and detect cross flow behind pipes. The tool incorporates a conventional spectral noise logging module (SNL) and a vector vibroacoustic logging module (VVL) which allows differentiation between horizontal and vertical components of flow. The tool can also be combined with a spinner.
Main Advantages
- Acoustic modules can be run in combination with a spinner to provide wellbore flow profile in a single intervention.
- The survey can be conducted in the presence of any type of fluid oil, water, gas.
- Presence or absence of cement behind pipes will not affect the data quality.
- The tool incorporates a gamma ray, temperature and pressure sensors and a casing collar locator (CCL) therefore capturing additional information in a single run.
- The presence of multidirectional sensors in the VVL module allows identification of horizontal and vertical components of flow.
The advantages listed above make this tool the most cost-effective flow profiling and leak detection tool in the market. Acoustic log data can be used to determine which zones are producing and which zones are not. This can give a clearer picture of the reservoir sweep efficiency and which zones are producing water. The tool can also identify fluid movement and crossflow behind the pipe, including channeling of fluids up into the annulus which could potentially cause well integrity issues. Depths of leaks in the pipe can also be detected. The results can then be used to determine if remedial action such as a water shut off, scab liner etc. is required.
Challenge
How to accurately measure the injection distribution profile behind the pipe. Some injection wells have been designed to inject via the tubing and the A annulus simultaneously. Conventional PLT tools can only directly measure the flow splits in the tubing and not behind the pipe. For example, when perforated zones are covered by a tailpipe or behind tubing it is not possible to identify the fluid intake profile into those zones. Using the acoustic logging tool provides the Client with an accurate view of the injection profile behind the pipe.
Acoustic Logging Result
One example when acoustic logging was conducted in an injector well with dual injection (A annulus and tubing) is shown below:
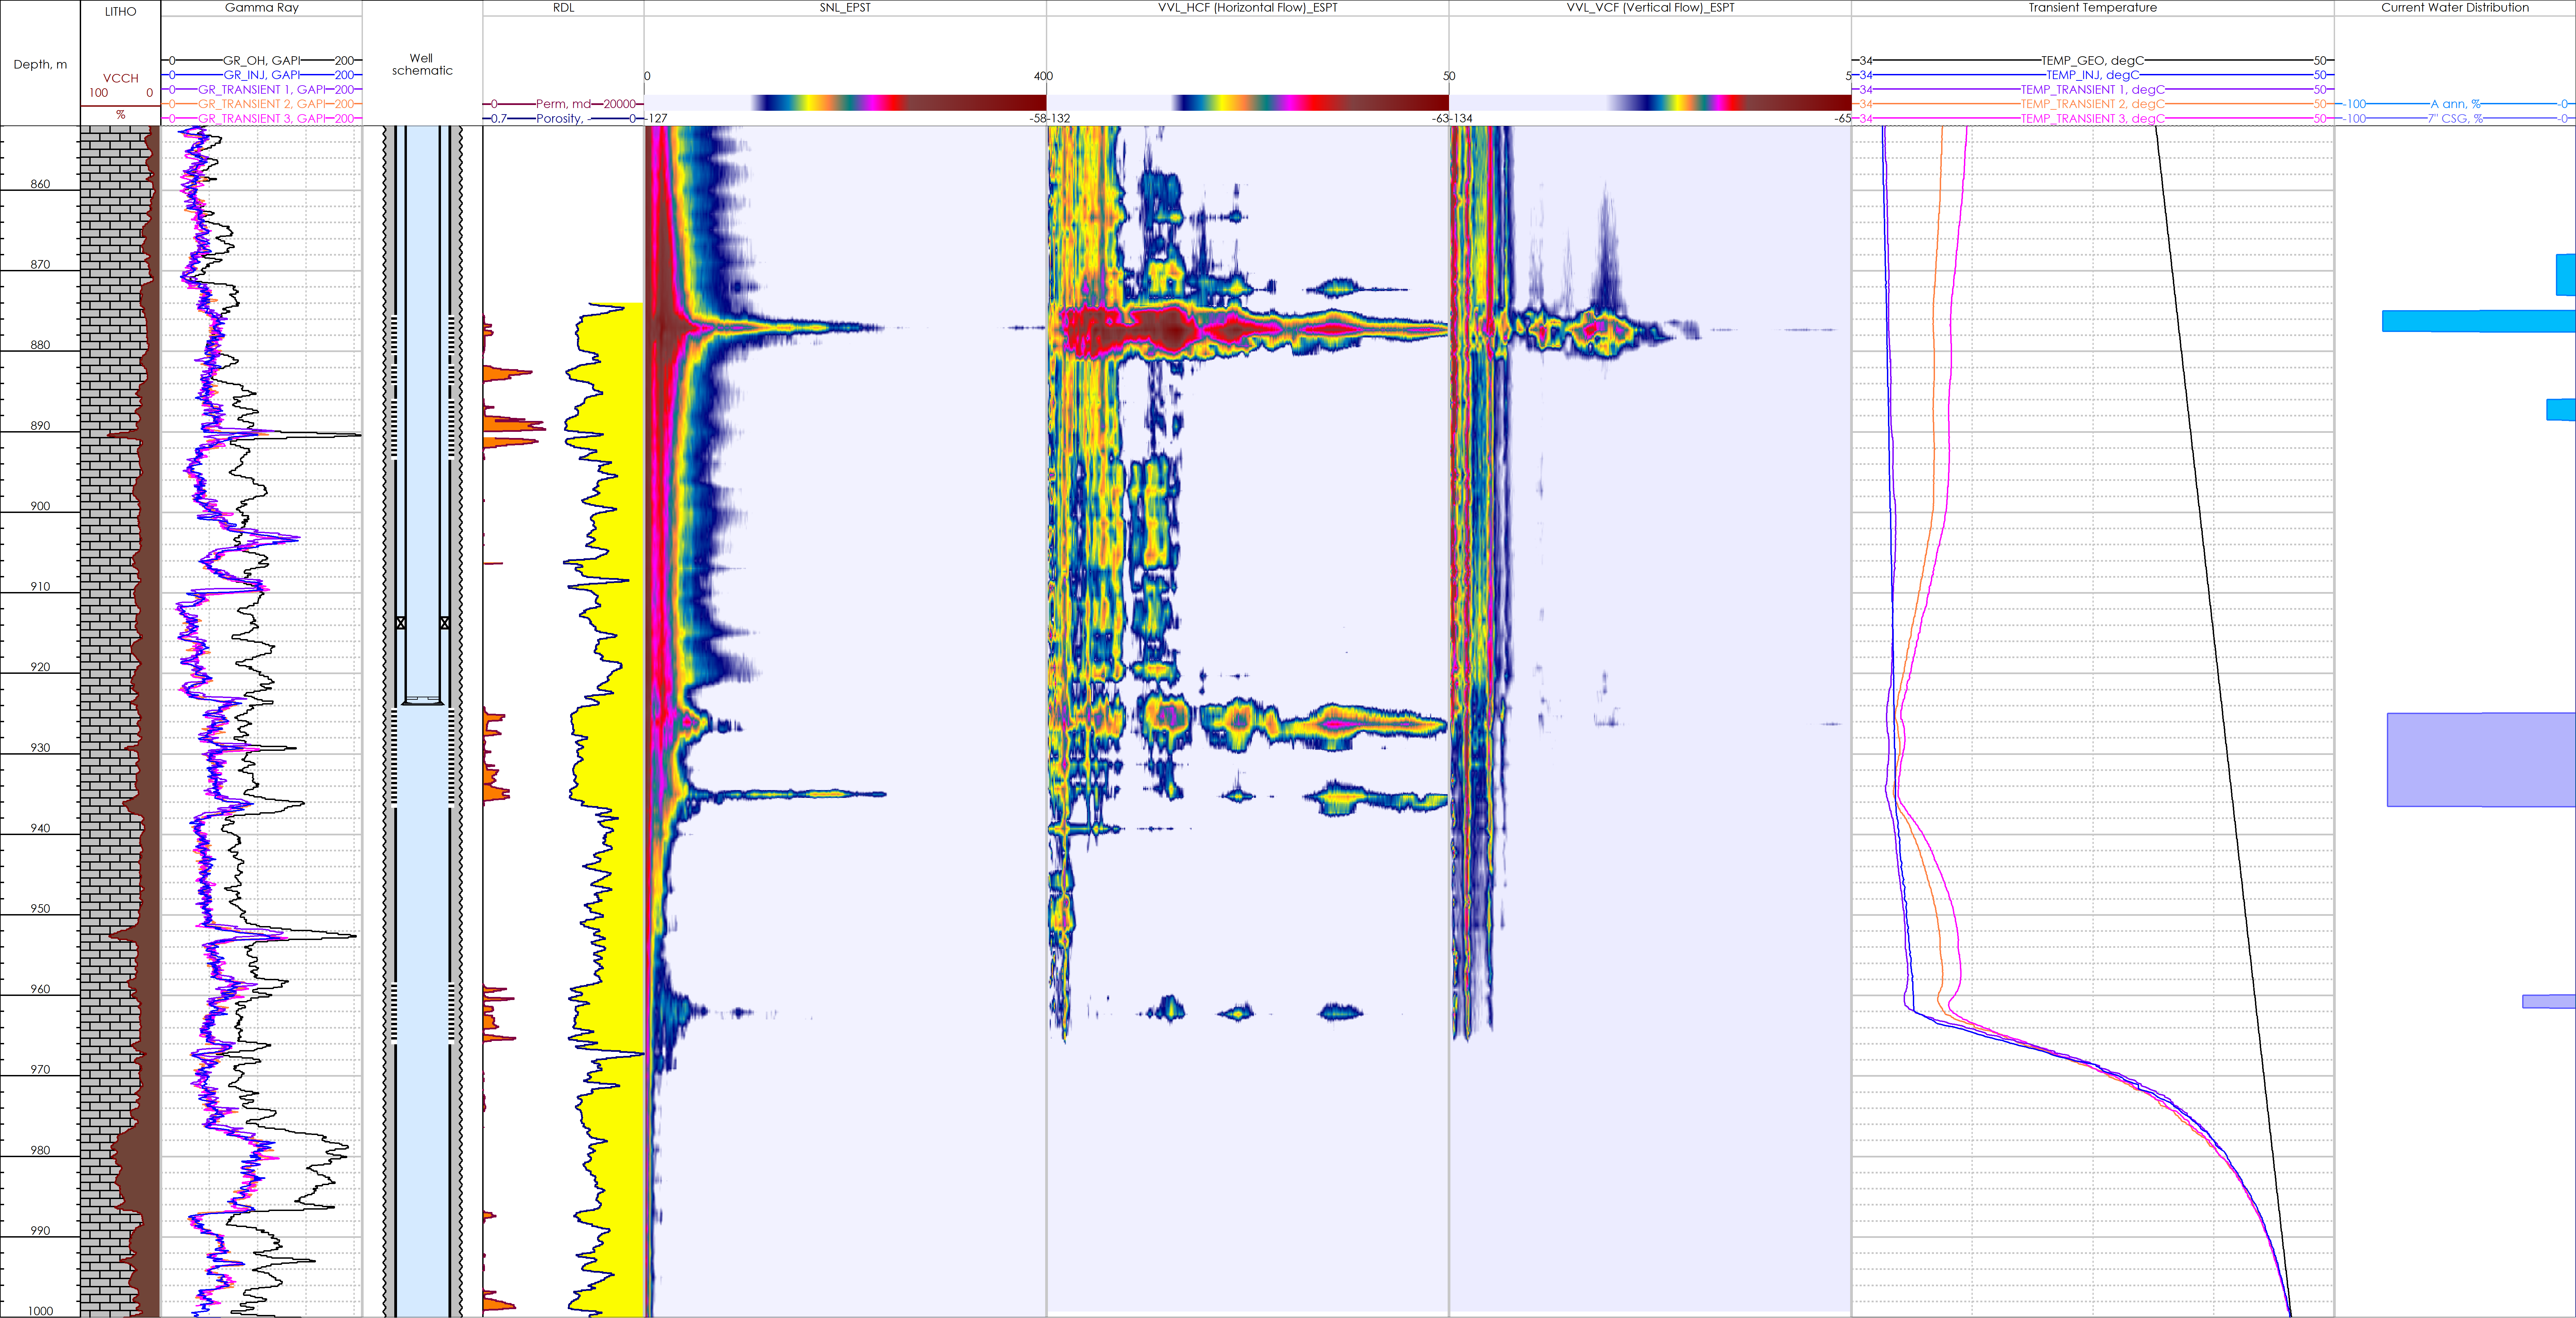
The well is a vertical water injector drilled in 2010. The well was completed with a 9 5/8” surface casing and a 7” production casing. The 7” casing has 5 sets of perforations. The 4.5” tubing with a packer was run in hole. The packer was set to isolate 3 upper perforated intervals from 2 lower perforated intervals to allow selective injection: 2 lower intervals though the tubing, 3 upper intervals through the A annulus. The average injection rate in the A annulus is 45 m3/d and in the tubing 200 m3/d.
The PLT spinner cannot measure the injection profile behind the tubing and an acoustic log was run to identify the intake zones. The injection temperature curve combined with the vertical component of the VVL log data confirmed there was no injection beyond 962 m. The SNL log and the horizontal component of the VVL log indicated that there was only one intake zone across the 1st perforation interval which is taking all the injected water pumped into the A annulus, whereas the 2nd and 3rd intervals have no intake. The majority of the injected water which is pumped into the tubing is going into the upper part of the 4th perforated interval which is covered by tailpipe. Two additional intake zones were identified: One is at the bottom of the 4th perforated interval and second is at middle part of 5th perforated interval. Note, all the intake zones are very narrow so the sweeping efficiency is quite low.
Conclusion
Acoustic logging is a powerful technique to provide accurate reservoir flow behaviors behind pipe which would otherwise be missed if only using a conventional PLT string which cannot measure flow behind the casing. This can aid the Client to determine how to improve vertical sweep efficiency and thus improve the overall areal sweep efficiency for accurate 3D dynamic modelling.
More case studies


Looking for more information?
Get in touch with us and our representative will get back to you
Contact Us